Running code and tests in Comma
Running tests
First, create a run configuration for running the tests.
- Go to the
Runmenu, thenEdit Configurations - Click the
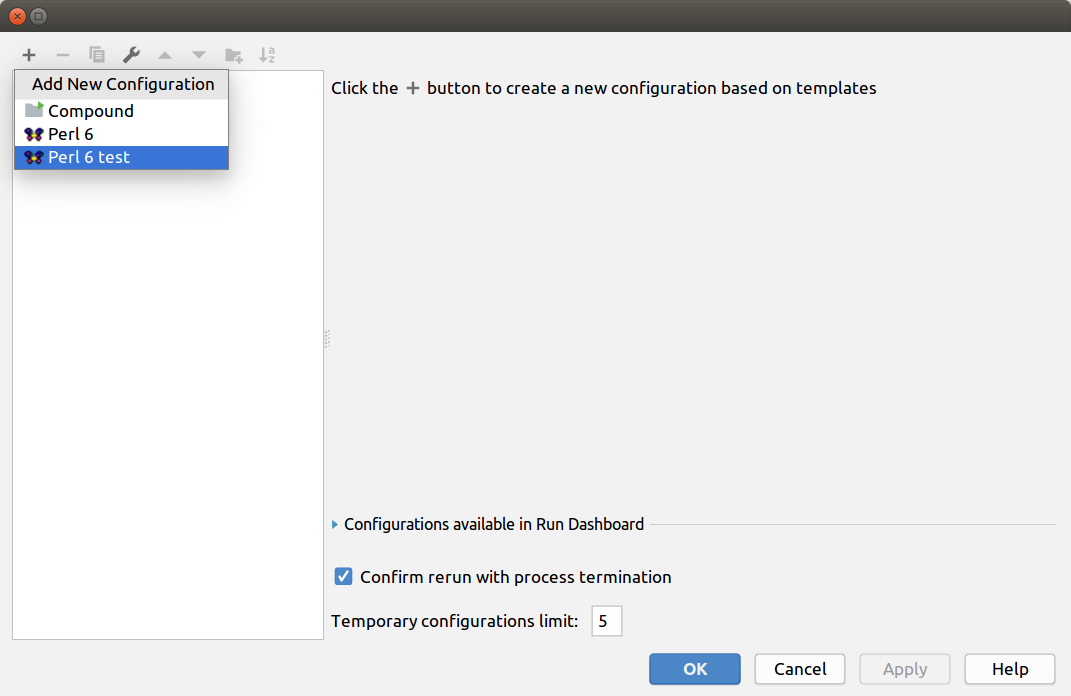
+icon in the top left corner and select Raku Tests
- Give this configuration a name, such as “Tests”
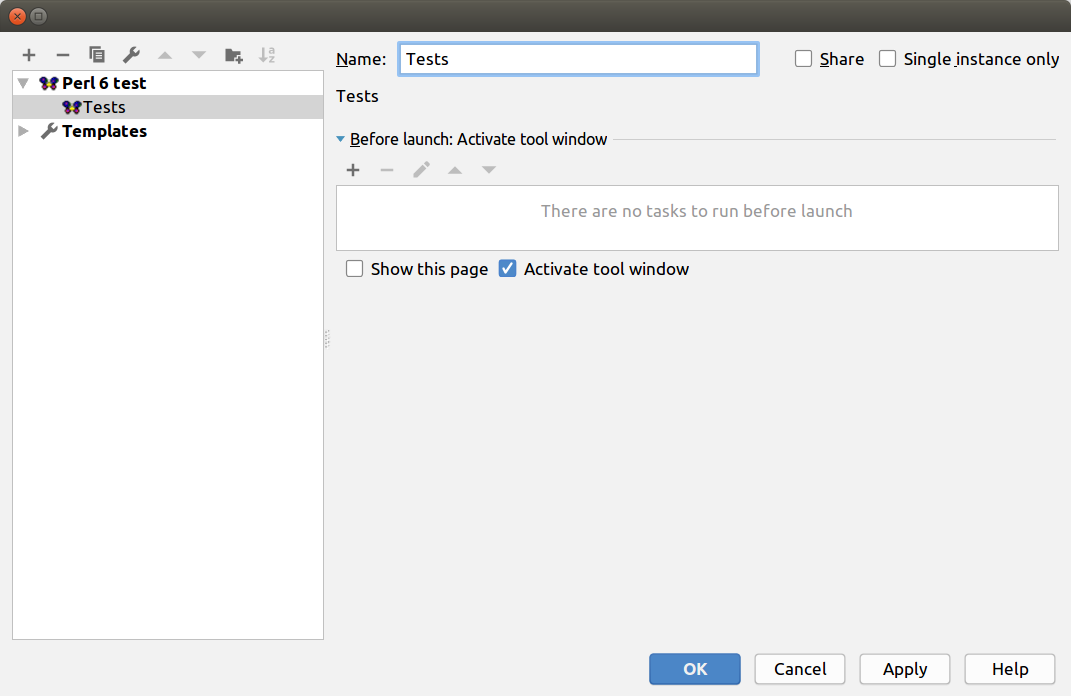
- Click OK.
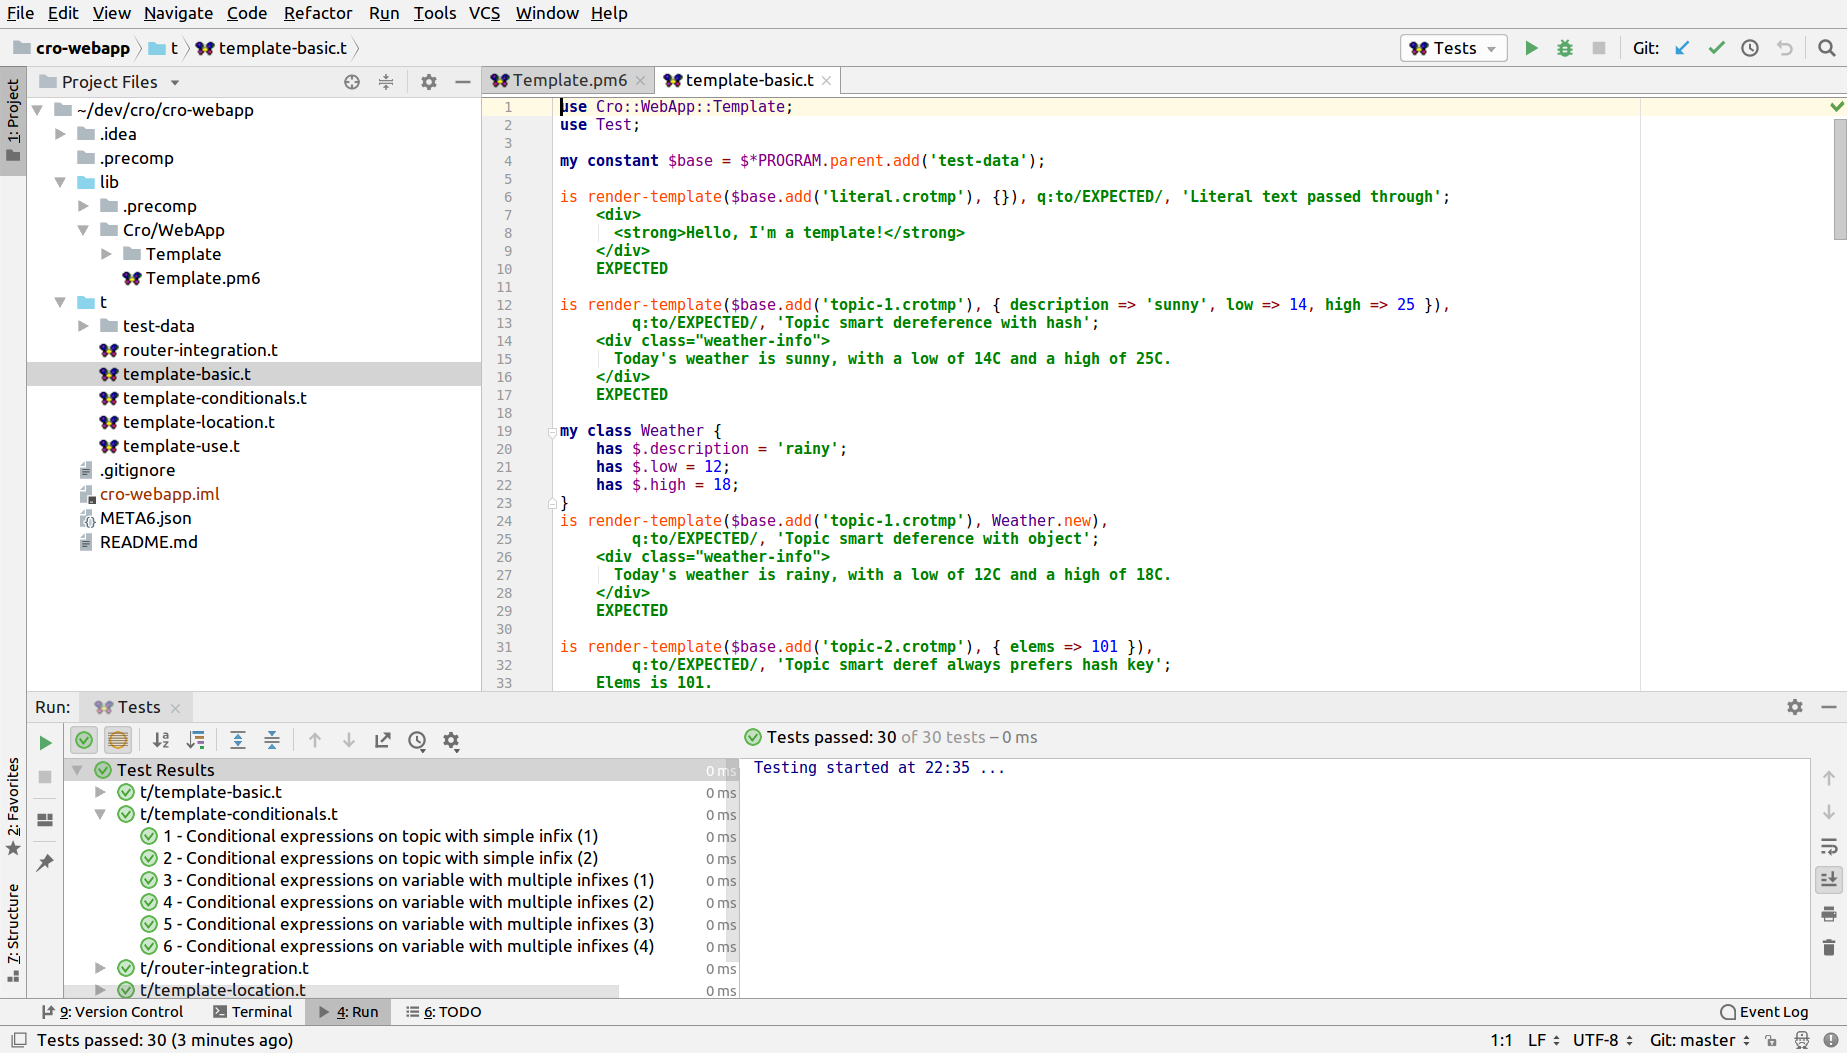
Now, to run the tests, either:
- On the
Runmenu, select “Run ‘Tests’” - Press
Shift+F10, if it was the last thing you ran
Running scripts
First, create a run configuration for running the script.
- Go to the
Runmenu, thenEdit Configurations - Click the
+icon in the top left corner and select Raku
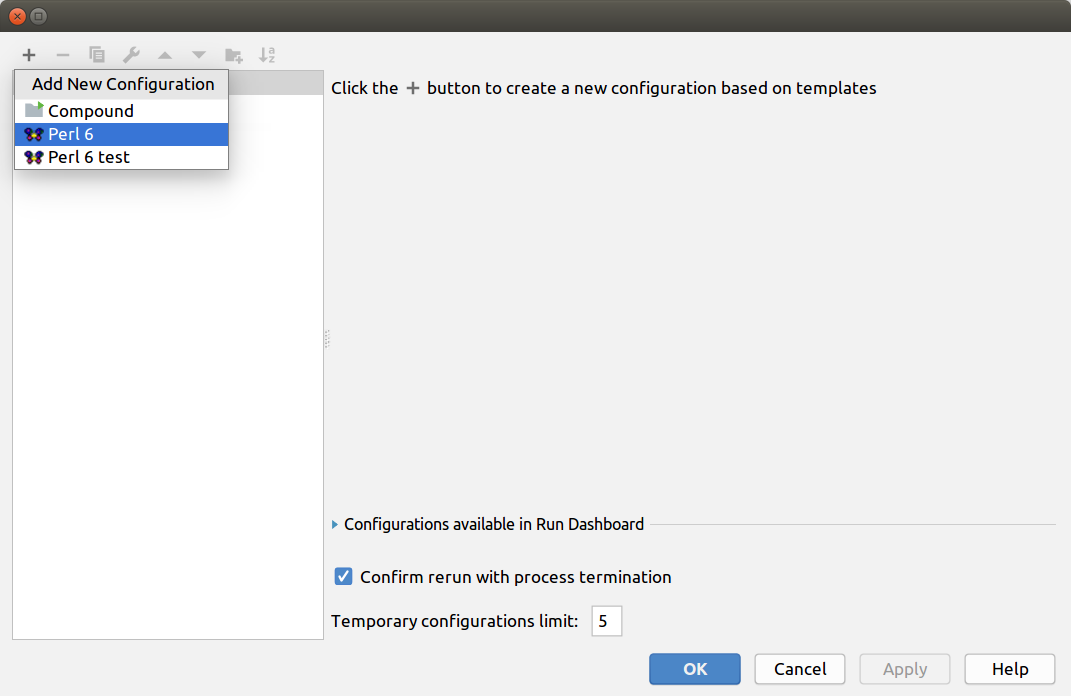
- Give this configuration a name, and select the Script, which is the program to run.
- Set up any additional parameters. It is common to add
-Ilibto the Raku Parameters, so that modules inlibwill be found.
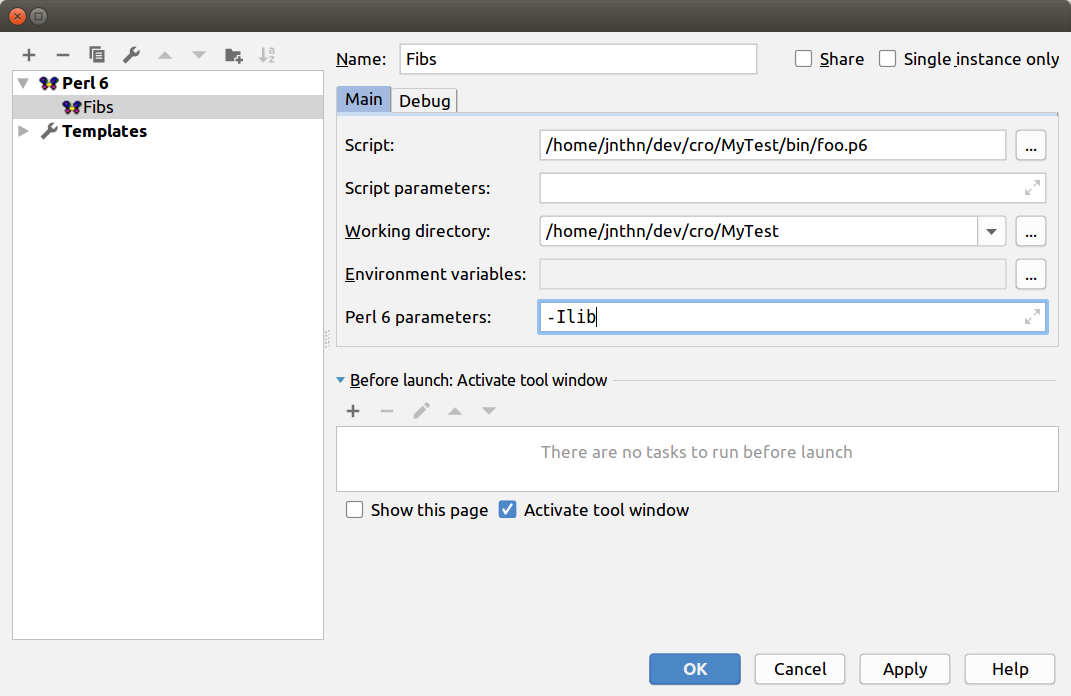
- Click OK.
Now, to run the script, either:
- On the
Runmenu, select “Run ‘<Your Name Here>’” - Press
Shift+F10, if it was the last thing you ran
Debugging scripts
- Follow the instructions for “Running Scripts” to create a run configuration
- Set one or more breakpoints by clicking in the left margin next to the line numbers. Breakpoints should go on lines containing a statement; that said, if they are put on an inappropriate line the debugger will try to fix that by placing them on the nearest one that can be stopped at.
- On the Run menu, select Debug to start debugging.
At present, the debugger always shows Raku data structures precisely as they exist.
For example, if we take the code my $a = 42, then $a points to a Scalar, which
has a $!value attribute, which in turn holds the Int 42. Each of those is represented
and can be expanded in the values view. For convenience, however, the value will be
rendered as $ = 42, immediately showing that this is a Scalar holding the value 42.
Similar applies to arrays and hashes: Array has a $!reified containing the non-lazy
elements, and Hash has a $!storage containing the hash values themselves. Comma
may in the future provide an alternative, simplified, view to hide these details.
Generally, the more recent the version of Rakudo/MoarVM you are running is, the better things will work. For example, releases 2018.12 and earlier had some missing symbol information, meaning some parameters or bound variables could not be viewed in the debugger.
Test coverage
Note: This feature is only found in Comma Complete.
First, see the Running Tests section above. With a Raku Test run configuration in place,
all that remains is to pick Run with coverage from the Run menu. It is also possible
to run a Raku script/application with coverage, in which case you can use the tool to
understand what code is touched by a typical usage of the application.
Coverage is presented:
- On the project sidebar, normally placed to the left. It not present, it is opened with
Alt+1. EnsureProjectis selected, notProject Files, in the dropdown on the top left of this area. Here, next to each module, the number of statements covered, number of coverable statements, and the percentage coverage is displayed. Color is used to give a hint of high, medium, and low coverage. These thresholds are currently hard-coded; send us feedback if you wish to be able to configure them. Note that some files have no coverable statements. For example, a file containing a class without any methods, or a role that only has stubbed methods, has nothing that can be hit by coverage analysis. - Alongside the code in a file. Covered lines get a green margin marker to the left of them.
Occasionally, tests have been seen to fail under coverage analysis, even if they run perfectly fine without it. This appears to be a MoarVM bug, and we’ll work with the MoarVM team to resolve it.
Profiling
Note: This feature is only found in Comma Complete.
If you don’t already have a run configuration for the program to profile, see Running
Scripts above. Once that is done, the Run menu will then contain a Run with profiling
option. Use this to run the program to profile. The results will be imported afterwards
and displayed in a tool window.


