

Concurrency timeline viewer
What is it?
The timeline view provides insight into how time is spent in an application at a high level, and is especially suited to understanding how work is being parallelized or the relative timing of asynchronous operations.
Applications and modules use Log::Timeline
to annotate the code with tasks (things that happen over a period of time)
and events. These can then be visualized in Comma. While you will need to
add such annotations to your own applications, some modules already have
Log::Timeline annotations. Of note, many parts of Cro
already use it, meaning that if you’re building a Cro web application, you
can start understanding how time is spent processing requests right away.
Showing the timeline
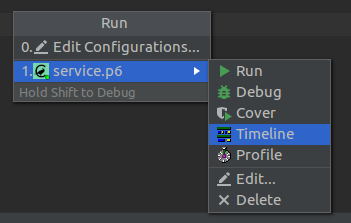
First, you should have a Run configuration of either the
“Raku” or “Cro Service” type. With that in place, choose “Run and show
timeline” from the Run menu if that run configuration is the most recent
one, or choose Run..., select the configuration, and then choose the
Timeline executor.
Understanding the timeline
Here is an example involving loading the homepage of a web application after application startup.
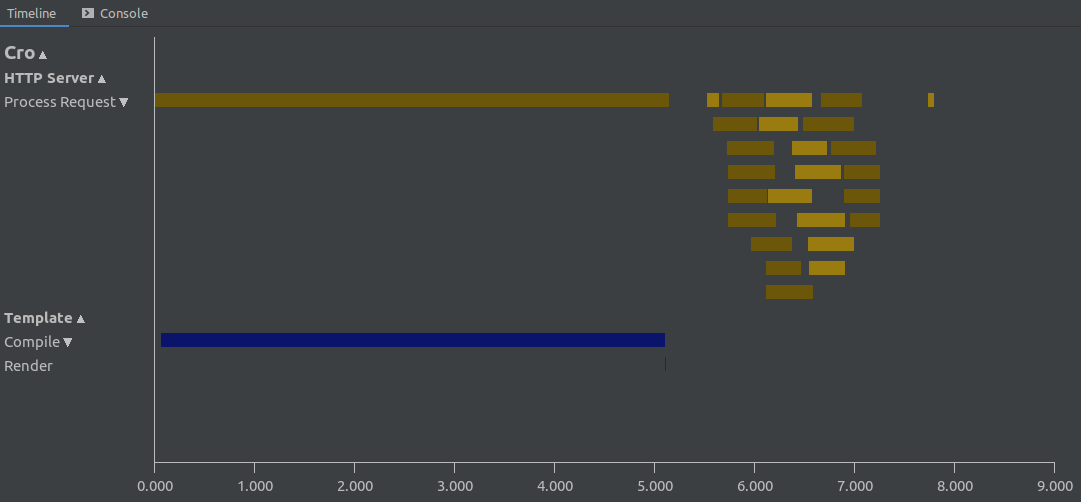
We have output from two different parts of Cro: the HTTP server and the template renderer. We can see that there is a single initial long-lasting request. That is followed by a number of follow-up requests, which were processed concurrently, with up to 9 requests at a time. When there are multiple overlapping tasks of the same kind, the timeline viewer packs them into the minimal number of rows, allowing us to understand how much concurrency there is.
The alternating light and dark variants of a color do not have a semantic meaning; instead, they exist to make it easy to pick out two different tasks of the same kind where one starts immediately after the other finished.
Further down, we see the probable cause of the initial request taking so long: compiling templates. Thankfully, the rendering of the template was a great deal faster - a good thing, since compiling Cro templates will happen once in the application lifetime, but rendering them many times.
Getting more detail
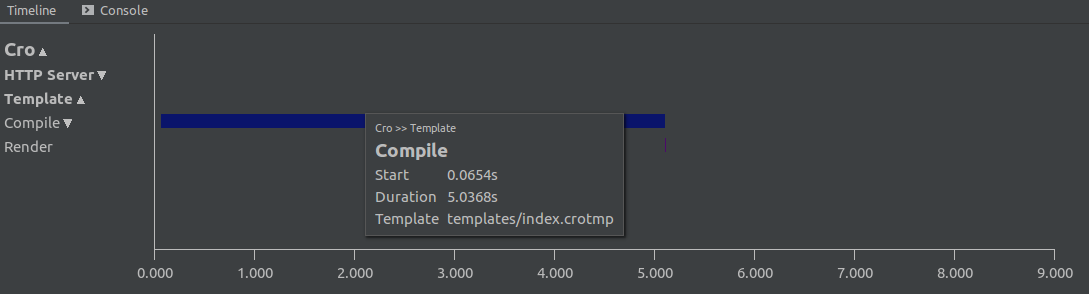
Hovering over a bar on the timeline shows the start time and duration, followed by any extra information that was logged. In this case, we see the name of the template that was being rendered.
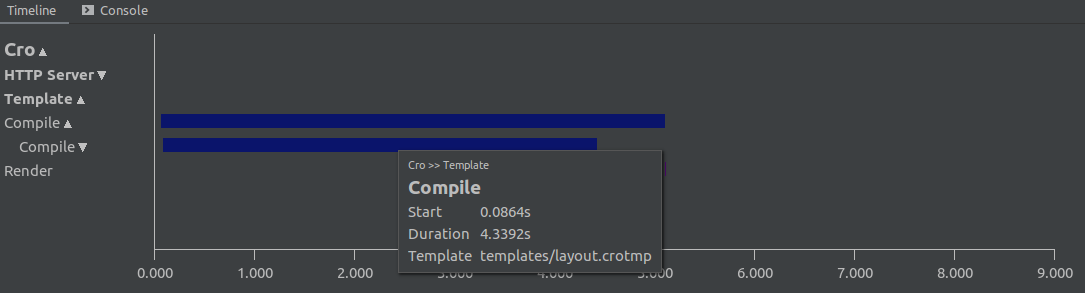
We can then drill down and see that much of the time was spent on the compilation of the layout template:
Navigation
The timeline can be explored as follows:
- Zoom in/out:
Ctrl & Mouse Wheel, orCtrl & +andCtrl & - - Move left/right (time axis): click and drag or left/right arrow keys
- Scroll through rows: mouse wheel or up/down arrow keys